Method · Built to show its pulse
A system should not be silent until it breaks.
A public feature can look finished while the inside is dark. The button works; an email maybe sent, a job maybe ran, a vendor call maybe succeeded. This page shows the other half of a serious system: the surfaces that let you see what actually happened — what is running, what is failing, whether the promised workflows still hold — and the places the system is still blind. Every screen below is a real production admin, not a mock-up.
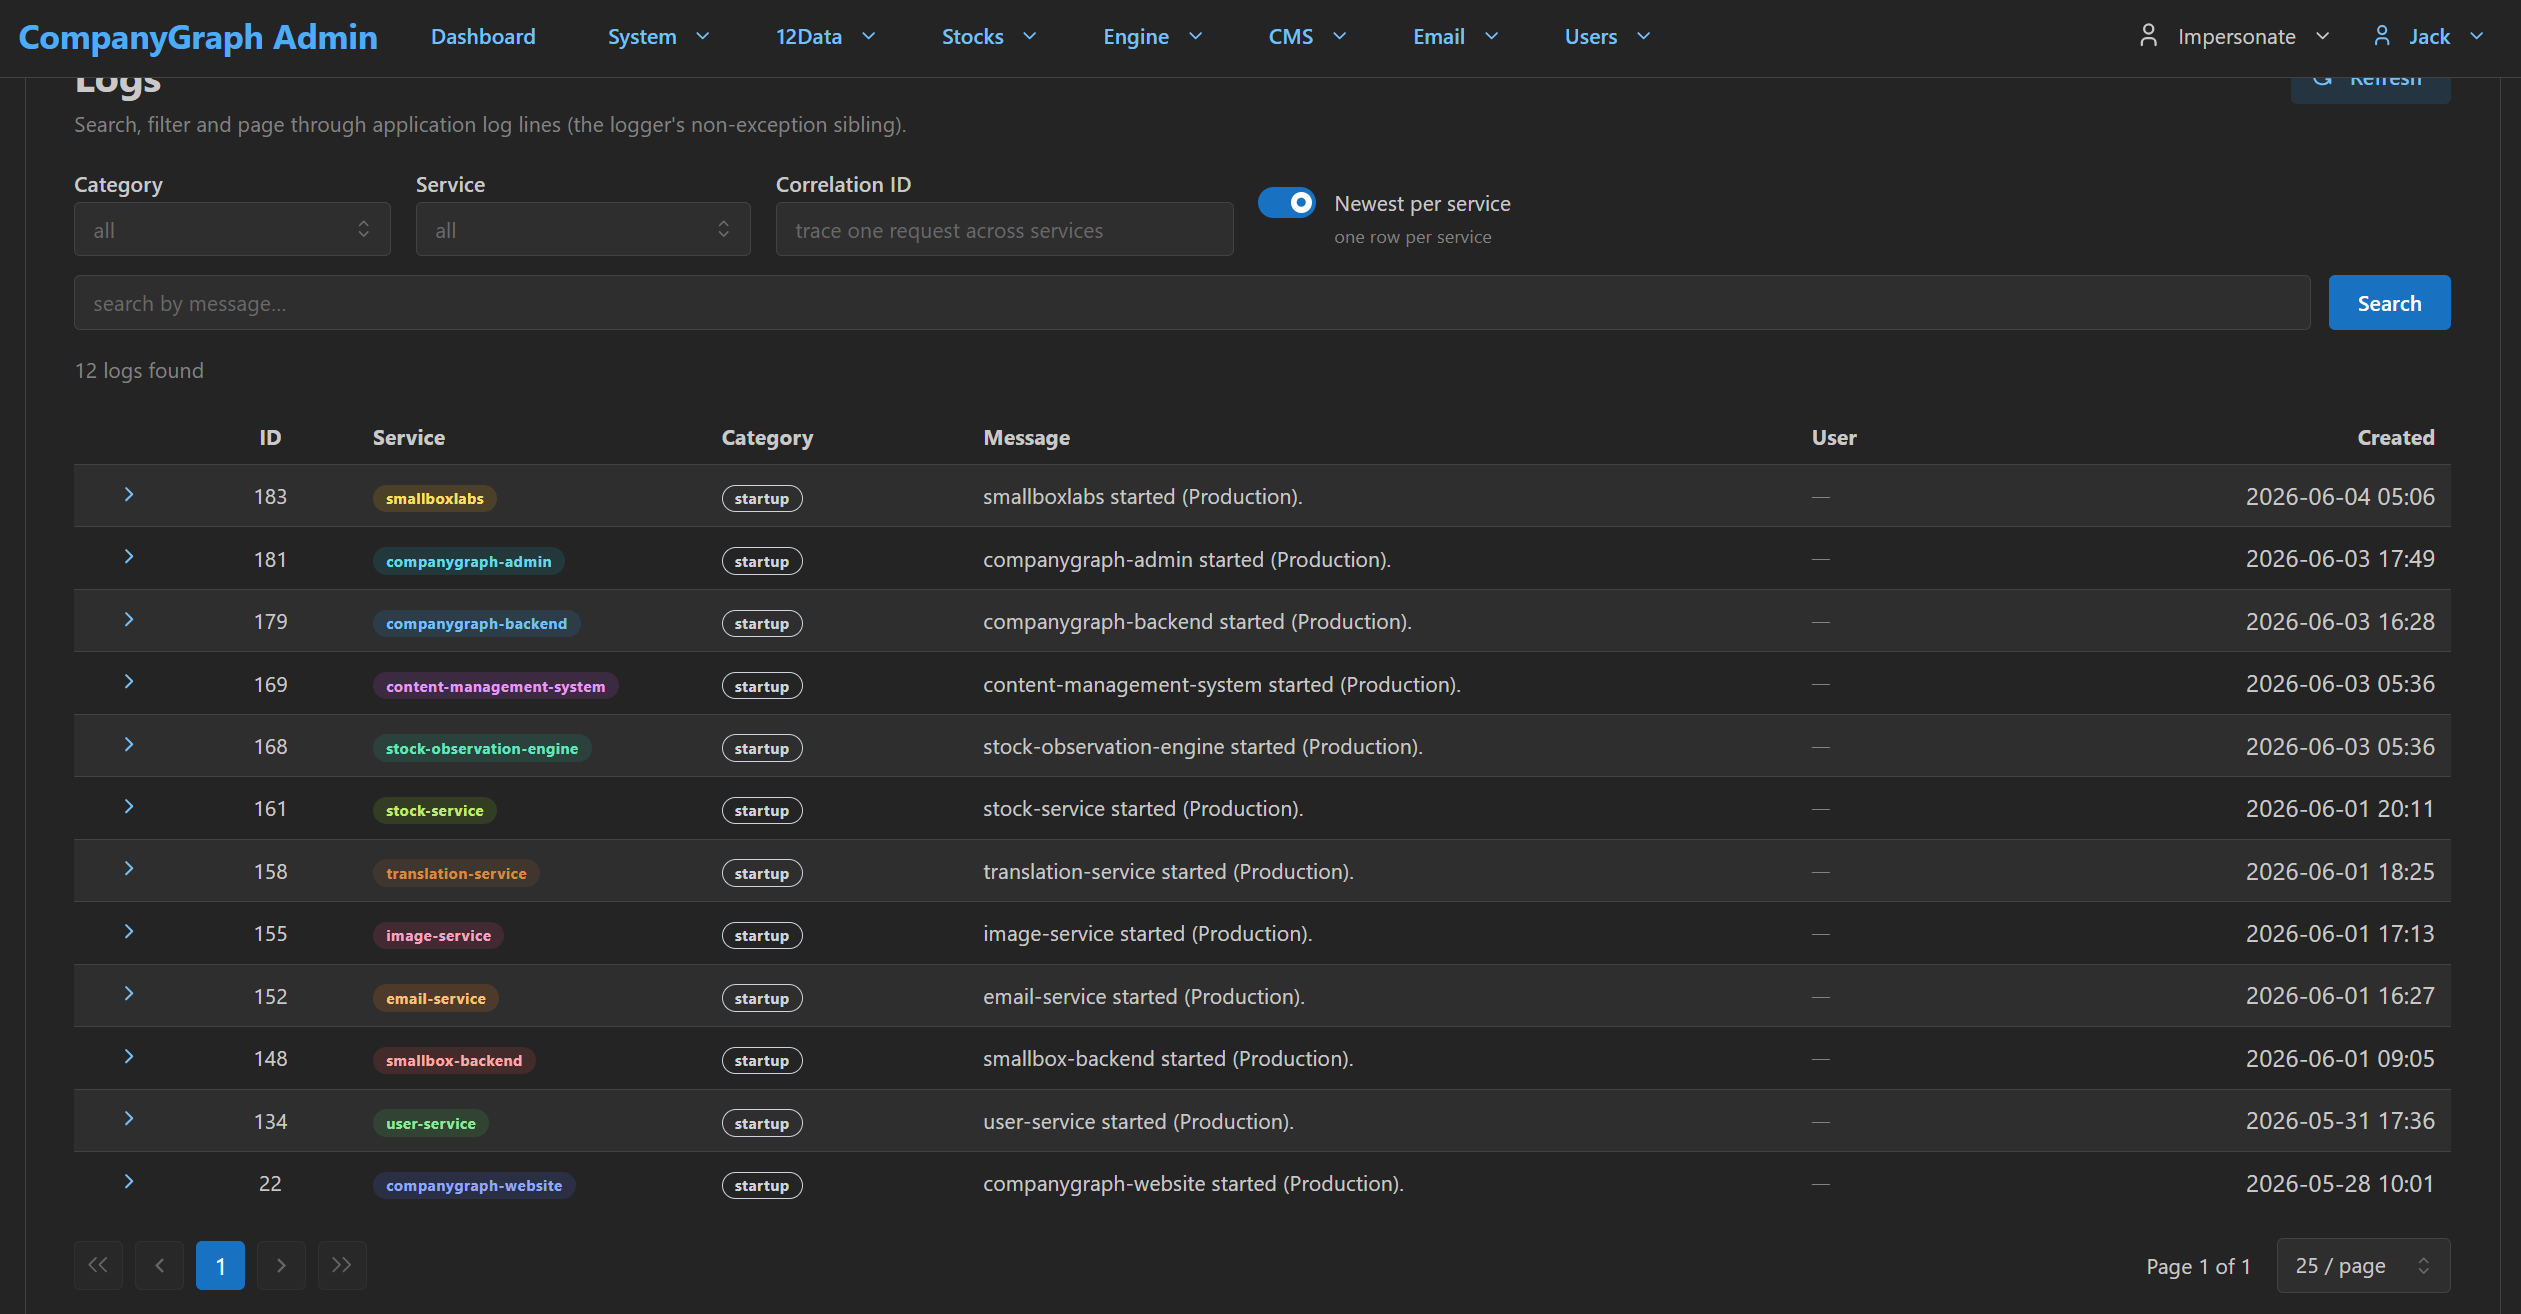
The short version — a Smallbox system leaves traces: emails sent, jobs run, imports finished, vendor calls made, exceptions caught, tests passed. Those traces are what let you operate it, debug it, hand it over, and keep improving it — without the person who built it in the room.
The expensive moment with a black-box system is not the bug. It is the half-hour after the bug, when a customer asks what happened and the only person who can answer is the developer who built it — if they are still reachable. Visibility is what turns that half-hour into thirty seconds, and what lets someone other than the original author keep the system alive. The vital-signs framing below is not decoration: each sign maps to one admin surface you can open and read — and every part of the system reports into one place first.
A finished surface can be blind inside.
A deployed product that looks done can expose nothing about its own state. When something goes wrong — a payment, an import, a transactional email — the business has no place to look, so every question routes back to one developer. That dependency is the real cost. Not the failure itself, but the blindness around it, and the way the blindness makes one person load-bearing.
Smallbox builds the opposite. Important workflows leave traces: a job records that it ran, a failure is captured with a time and a source, a promised behaviour is tested and the result is written somewhere a non-developer can read it. This is not “monitor everything.” It is practical visibility for a small serious system — the few surfaces that answer the questions a real operator actually asks.
The accepted cost is honest: traces are built in as each workflow is written, which is effort spent up front. The payoff is that the same effort is a fraction of the price designed in than it is bolted onto a black box already running in production. That trade is why visibility belongs in the foundation rather than in a later “monitoring” project.
Temperature: what is failing, and is it the same thing?
The first thing to watch is whether errors are rising, and whether one failure is repeating. A rising temperature is only useful if you can see its shape.
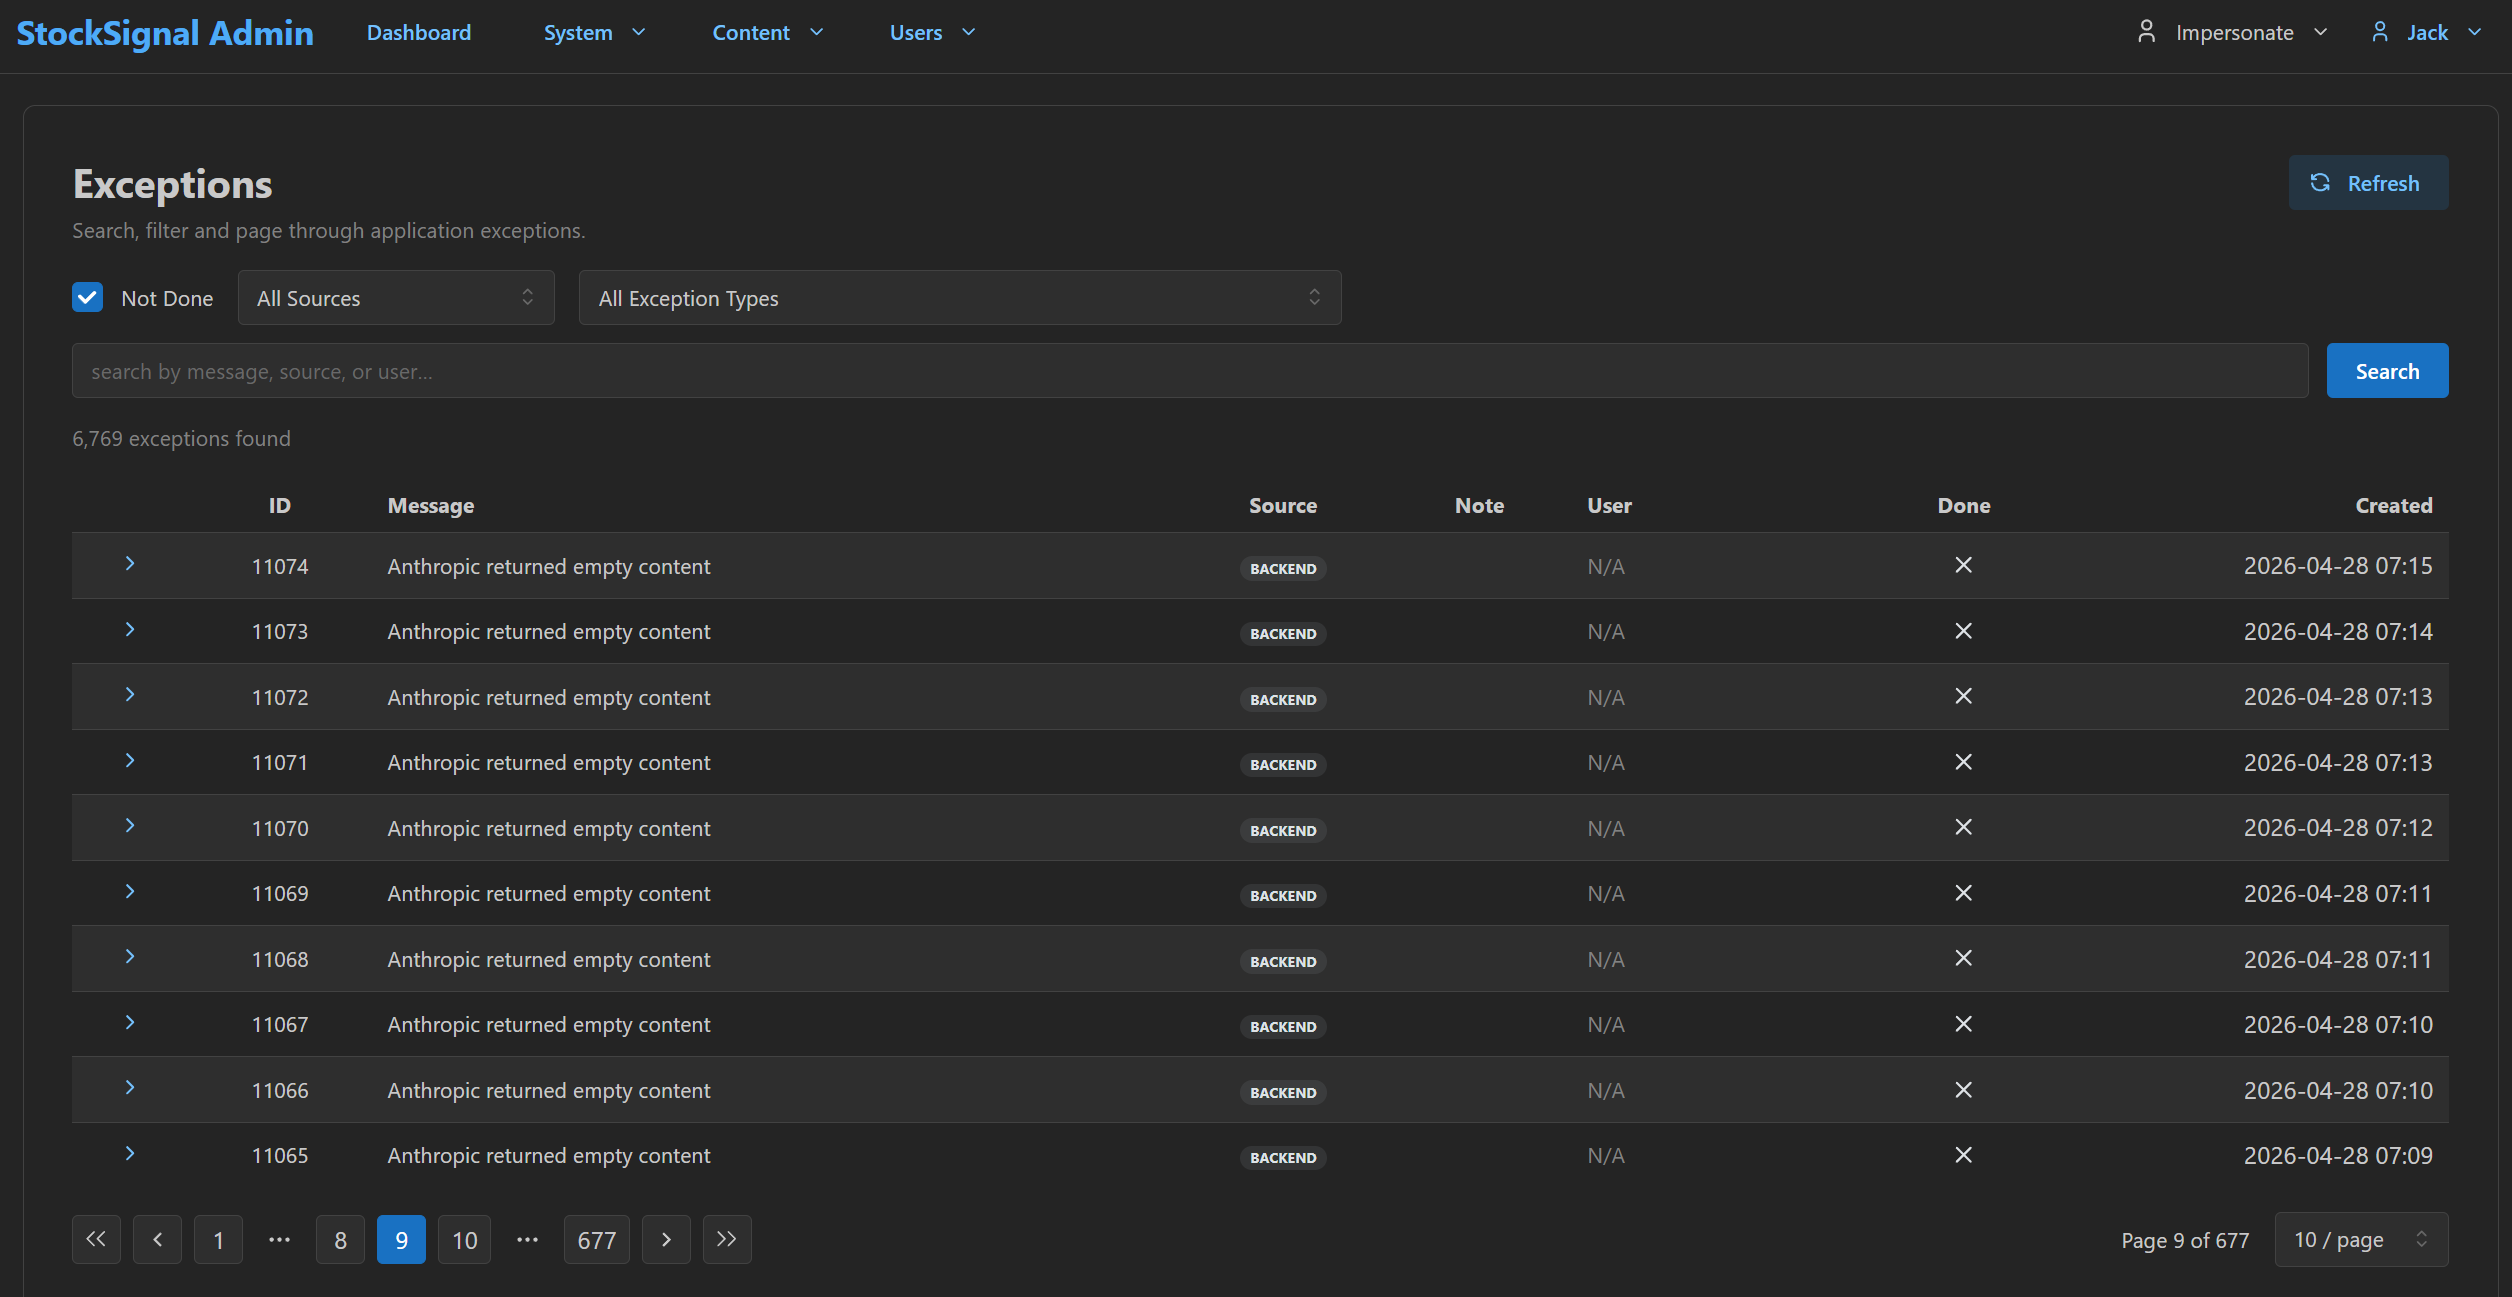
One message repeating thousands of times is itself the diagnosis: a single upstream behaviour — the language-model provider returning empty content — not thousands of unrelated faults. When a customer reports a missing generated description, you search the message, see a known pattern with a count and a date range, and answer from evidence instead of guessing. The same surface is what tells you whether a generation job is safe to switch on: a failure mode this visible and this counted is one you decide about deliberately, rather than absorb silently.
Reflexes: do the promised workflows still hold?
Temperature describes the system as it runs. Reflexes ask a different question: do the behaviours we promised still pass — sign-in, a sent email, a stored translation — right now, per service. The answer is recorded where the business can read it, not buried in a build log only the developer ever opens.
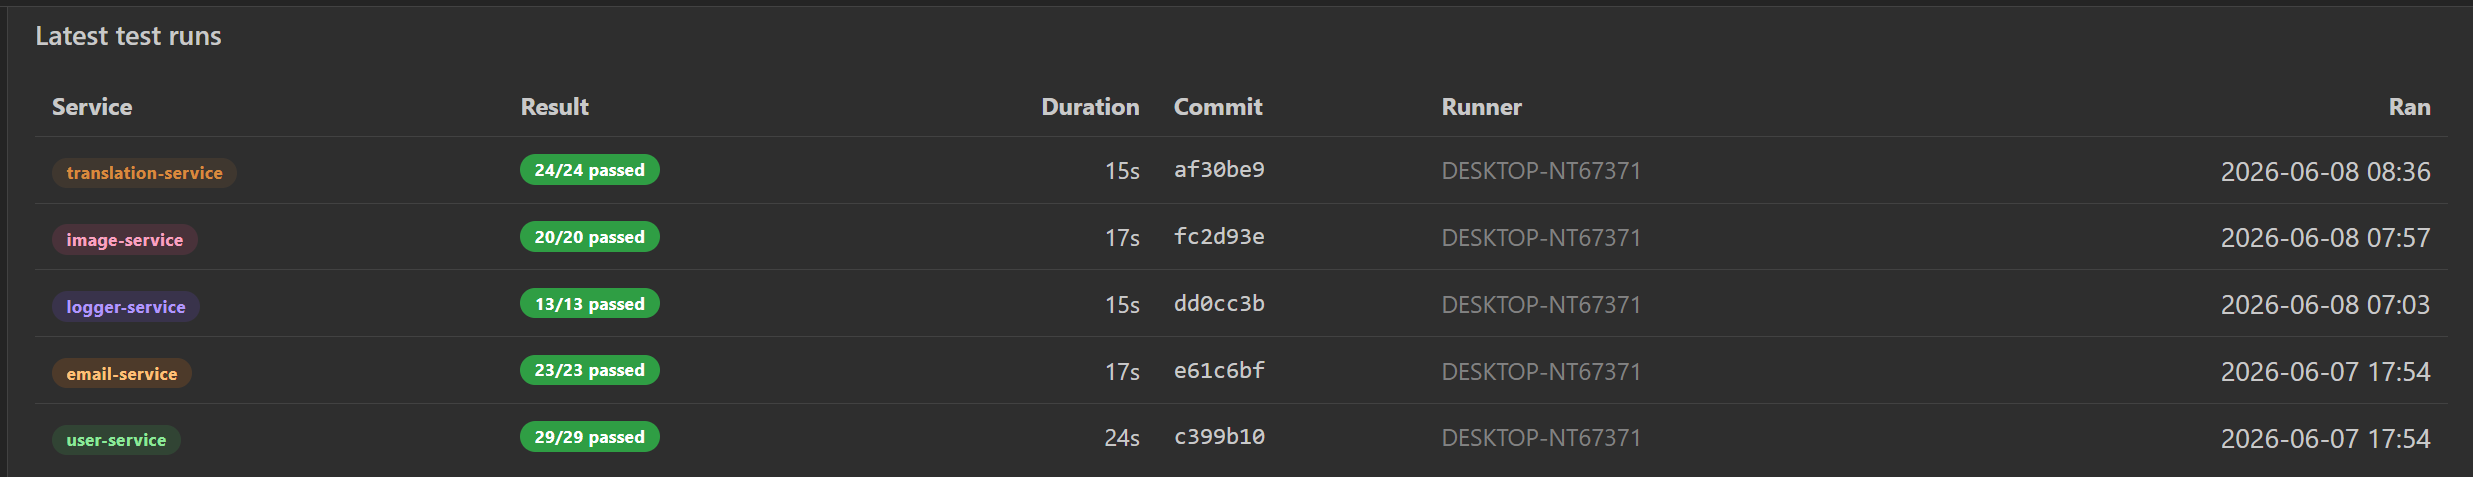
This is the surface that connects “the workflow you paid for” to “and it still works.” The distinction it relies on is that a green test only counts as evidence when it is anchored against reality the test author did not invent — a real round-trip through the database, a real call across a wire. A board full of green numbers from tests that mock everything they touch would prove almost nothing; these don’t. The honest limit is on the page too: a passing count means the promised behaviours held in the last run, not that every behaviour is covered. The board shows which services report, and when each last ran.
External pressure: are the vendors behaving?
A system is only as predictable as the outside services it depends on, and those are where reality gets messy: APIs fail, rate-limit, change format, and bill per call. This surface makes that behaviour — and its cost — visible in one place.
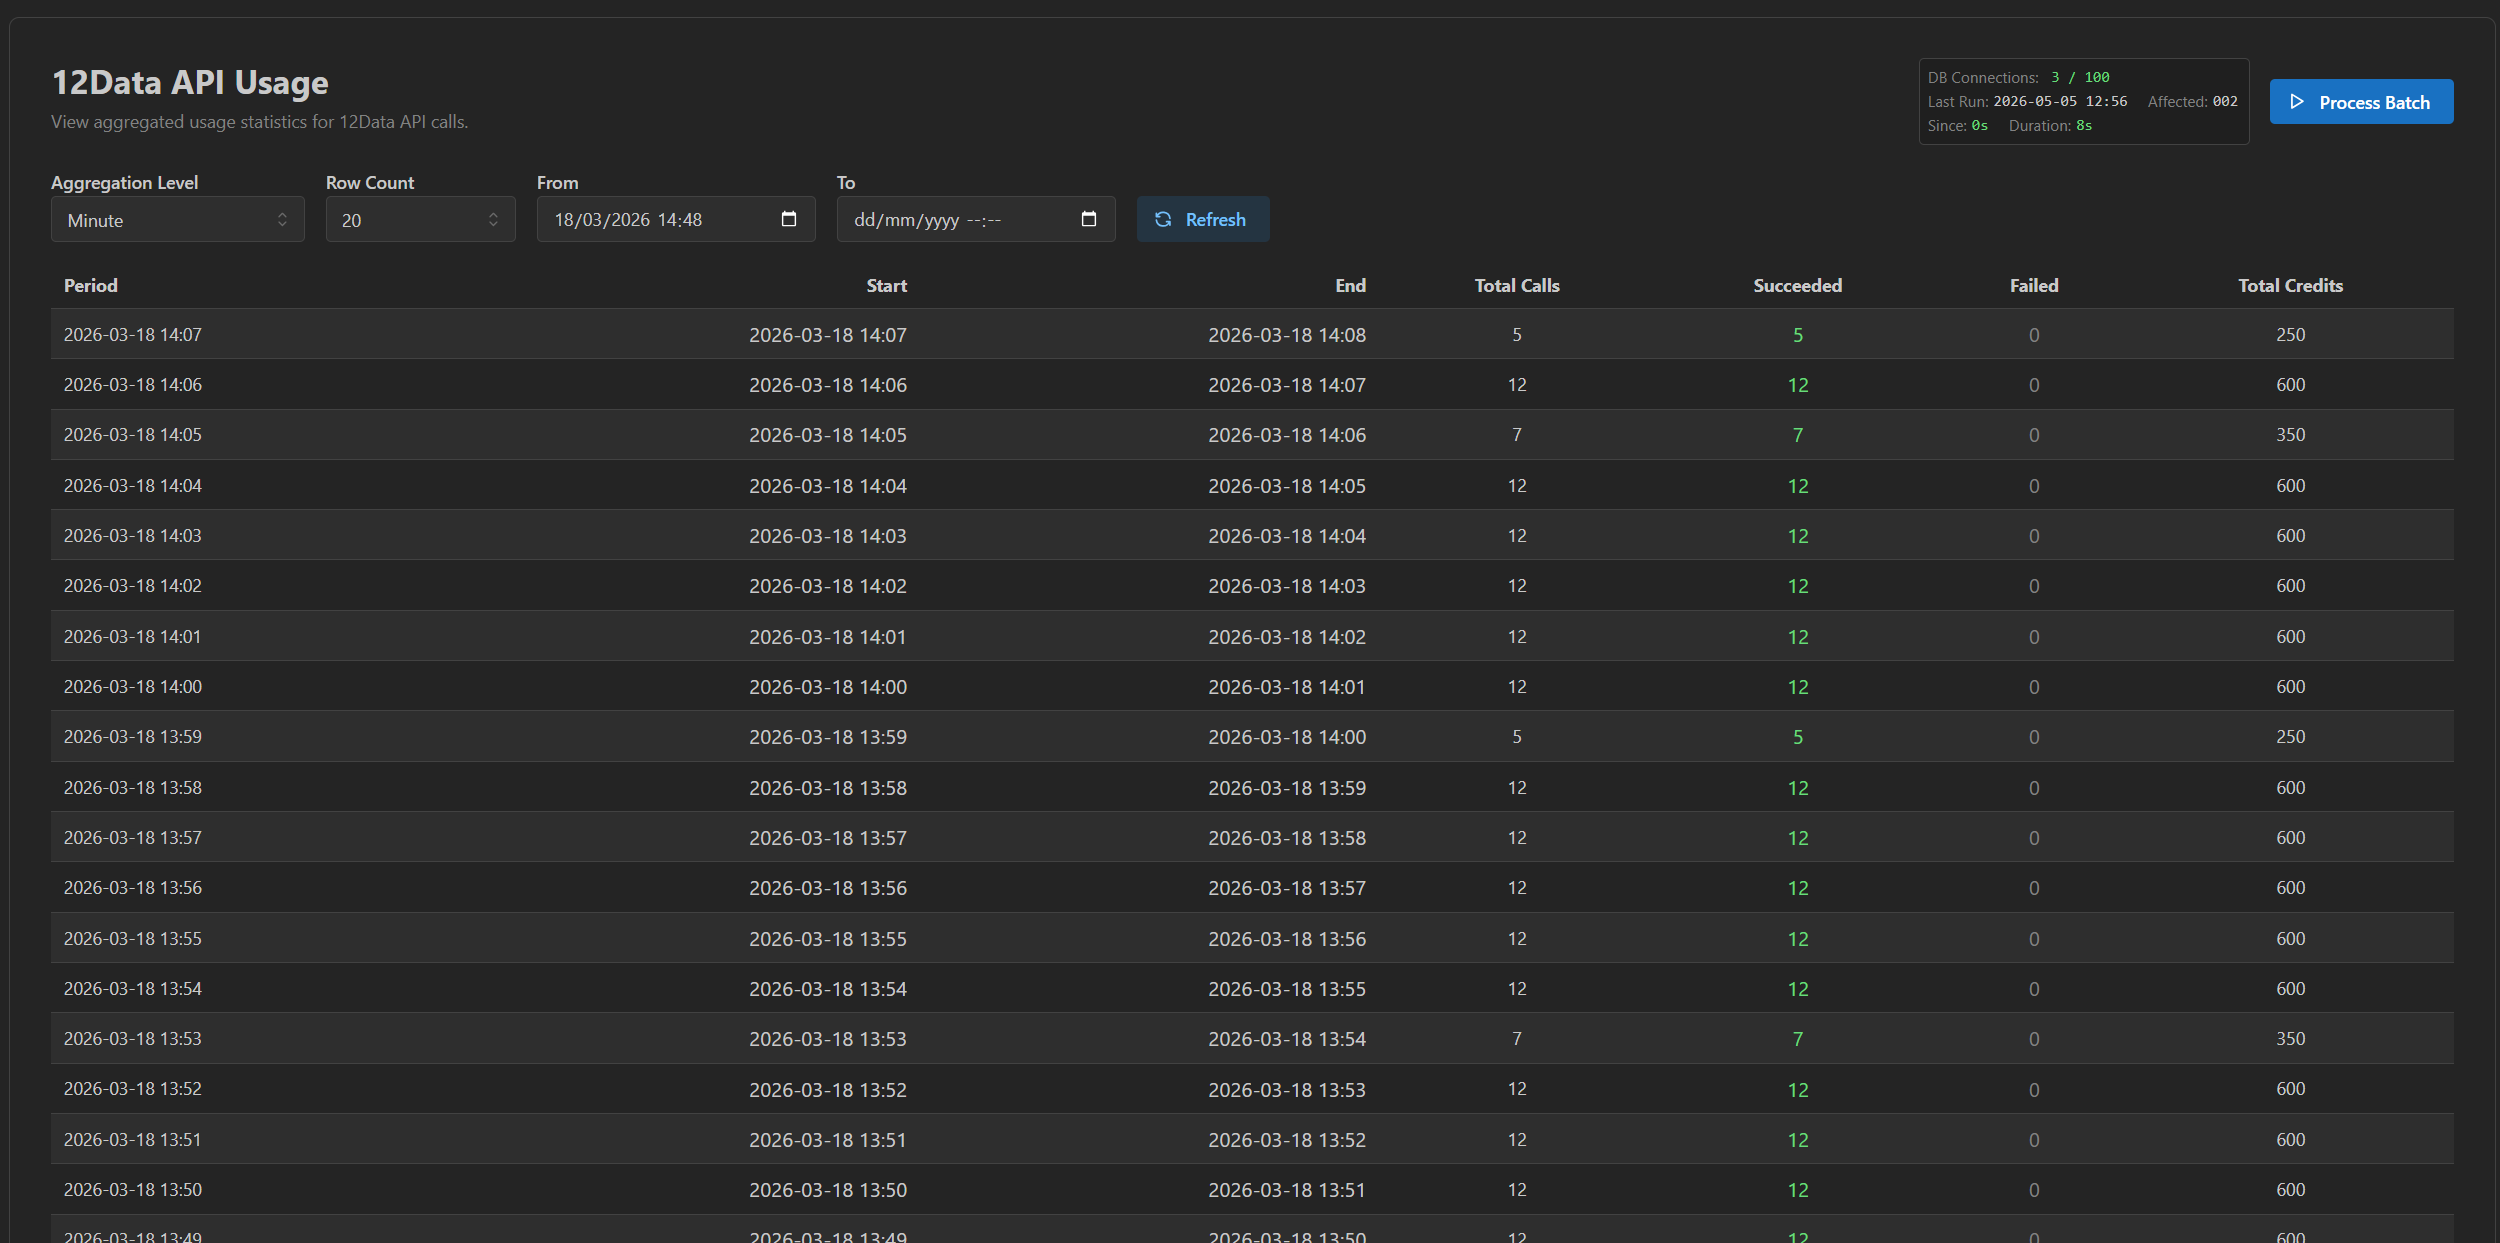
Putting failures and credits next to each other means a spike in either is something you see, not something an invoice tells you a month later. This is the kind of system where visibility stops being optional — API-heavy, metered, batch-driven. The more a product leans on outside services, the more its calm depends on being able to watch them.
Readable by people, and by an AI agent.
The same surfaces serve three readers, and the reason to build them is different for each.
- The owner — control
- Your team can answer “what happened?” without routing every question to one developer.
- The developer — orientation
- A place to look first — which job ran, what failed, what changed — instead of rebuilding the picture from scattered code under pressure.
- The AI agent — evidence
- An assistant can reason from a log line, an exception count, a green test, a heartbeat — instead of inferring from code alone and inventing the rest.
The third reader is the modern one, and the point is not that the system is “built for an AI.” It is built to be readable, and an AI coding agent is one more reader that benefits. The connecting idea across all three is orientation: the system shows enough of its own state that whoever looks next — person or model — knows where to look, instead of guessing.
Orientation, not oracle: working with an AI agent without trusting its memory →
Where the system is still blind.
A page about visibility that only showed what the system can see would be the marketing it is arguing against. Three gaps are real and named.
- The pulse is read, not pushed. Nothing pages anyone; you have to open the page. There is no alerting layer, on purpose. CompanyGraph is not yet live with paying users, and building an on-call stack before there is real load would be discipline spent in the wrong place. When the load is real, alerting is the next layer. Until then, the surfaces are read by a person who chooses to look.
- The signs are separate instruments. Exceptions, vendor usage, and the test board each answer one question well. There is no single screen that turns everything green or red at a glance; the test-run board is the closest, and only for the services that report.
- Some gaps no dashboard catches. A deploy once logged success across three repositories while serving a stale binary from disk — invisible on every surface here, caught only by comparing two file timestamps. That story, and the gate that still does not catch its whole class generically, is documented in full on orientation, not oracle.
The visibility is honest about its own edges. It shows what it shows, and it does not pretend to show the rest — which is itself the point. A surface you can trust is one that tells you where it stops.
Why this matters after the demo works.
A demo proves the happy path once. A foundation is what lets the system be operated, debugged, and handed to someone else for the months after. Visibility is the part of the foundation that is invisible in a demo and decisive afterward — the difference between a product you own and a product you are hostage to.
Built in from the first workflow, it is cheap: the traces are a property of how each path is written. Added to a black box already in production, it is expensive and partial — you are reconstructing what the system should have been recording all along. That asymmetry is the whole argument for putting it in the foundation.
The point is not a wall of dashboards. The point is a system that does not stay silent until it breaks.
This is how we'd instrument a system you inherited too.
The same instinct that puts a service heartbeat, an exception count, and a test result where a non-developer can read them is the one we bring to a backend you have inherited — making its real state visible before changing anything, so the first safe change has somewhere to be seen.